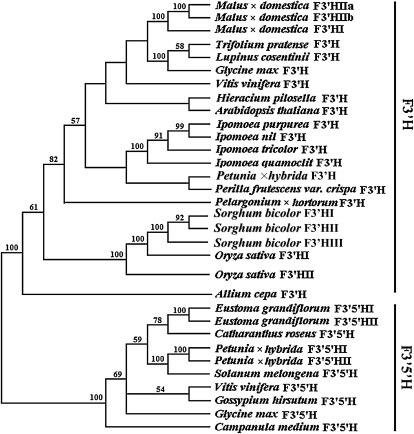
Figure 4.
Phylogenetic tree derived from amino acid sequences of genes encoding flavonoid hydroxylase in plants. The phylogenetic analysis was performed using the maximum parsimony method. Numbers on branches correspond to bootstrap estimates for 100 replicate analyses using 500× stepwise addition of taxa; values less than 50% are not indicated.

