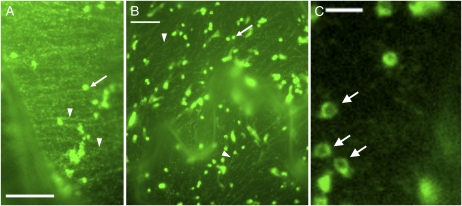
Figure 1.
Live cell imaging of the CSC. The images are taken of YFP-CESA6 fusion within the epidermis of a cotyledon petiole cell (A) and pavement cells (B). Bars = 10 μm. Examples of linear arrays, consisting of CESA6-containing complexes and cortical compartments, are shown by arrowheads. Arrows show Golgi that, in these pictures, yield a saturated signal. A close-up of Golgi taken with a lower exposure is shown in section C, where the characteristic ring-like appearance is observed (arrows). Bar = 3 μm.

