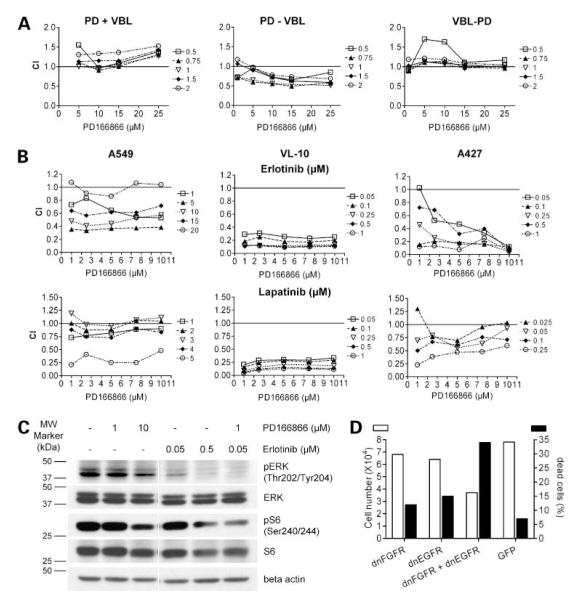
Figure 6.
Combination of small-molecule FGFR inhibitors with chemotherapeutic drugs and EGFR inhibitors. Concentrations of the drugs [vinblastine (VBL), erlotinib, and lapatinib] used for combination experiments (A and B, right) were selected from single substance dose-response curves (data not shown) and covered the range from ineffective to around 50% growth inhibition. A, A549 cells were simultaneously treated for 96 h with the indicated VBL + PD166866 combinations (left), 72 h with PD166866 followed by 72 h VBL (middle), or 72 h with VBL followed by 72 h with PD166866 (right) and cell viability was analyzed by MTT assays. B, NSCLC cell lines were simultaneously treated with the indicated combinations of the FGFR inhibitor PD166866 with the EGFR inhibitor erlotinib (top) or the EGFR/HER-2 dualtyrosine kinase inhibitor lapatinib (bottom) for 96 h in growth medium containing 1% FCS and cell survival was analyzed by MTT assay. Data in A and B present CI of the respective drug combinations calculated according to Chou and Talalay (19) with CalcuSyn software. Following this evaluation, CI < 1 indicates synergism, CI = 1 stands for additive effects, and CI >1 depicts antagonistic effects. C, effect of a 2 h exposure of the indicated RTK inhibitors on the phosphorylation of the downstream signaling molecules ERK and S6 was analyzed by Western blotting. Representatively, data for SCC-derived VL-10 cells are shown. D, VL-8 cells were transduced with dnFGFR1 or dnEGFR1 adenoviruses alone or in combination whereby the viral dose was kept constant by complementing with respective amounts of control virus. After 48 h exposure, numbers of viable (open columns) and dead cells (black columns) were determined by trypan blue exclusion assay.

