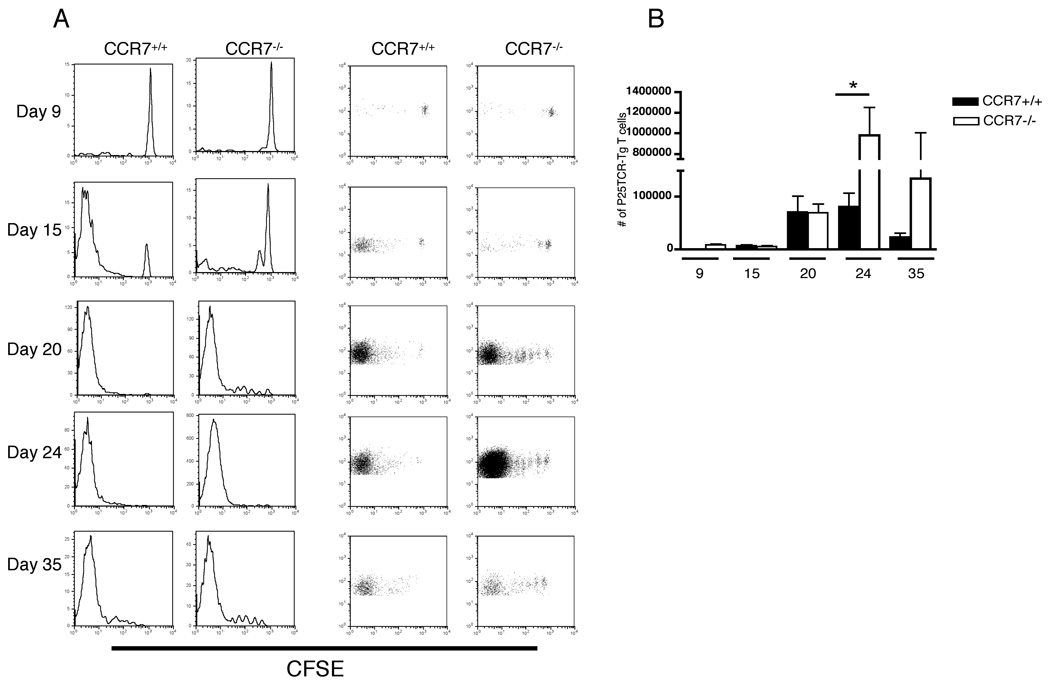
FIGURE 4.
M. tuberculosis Ag85B–specific CD4+ T cells proliferate in lungs of CCR7−/− mice. (A) CFSE dilution profile of P25TCR-Tg CD4+ T cells in the lungs of CCR7+/+ and CCR7−/− mice over the course of infection with M. tuberculosis. Plots are representative of four mice per group at each time point. (B) Total number of P25TCR-Tg CD4+ T cells was calculated within the CD4+ population in lung of CCR7+/+ and CCR7−/− mice. Data are represented as mean ± SD of four mice per group and per time point. * P = 0.016 by unpaired Student’s t test.

