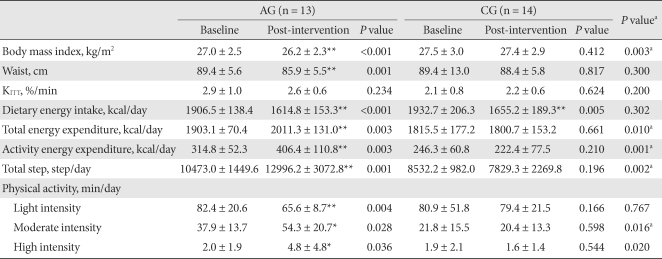
Table 2.
Changes in anthropometric, insulin sensitivity, dietary energy intake, energy expenditure and physical activity
The values were presented as mean ± standard deviation. Light intensity was defined as intensity level 1-3 from the accelerometer, moderate intensity from level 4-6 and high intensity from level 7-9.
AG, aerobic exercise group; CG, control group.
aP values for comparisons between the AG and the CG, *P-values < 0.05, **P-values < 0.01 for comparison between baseline and intervention within group.

