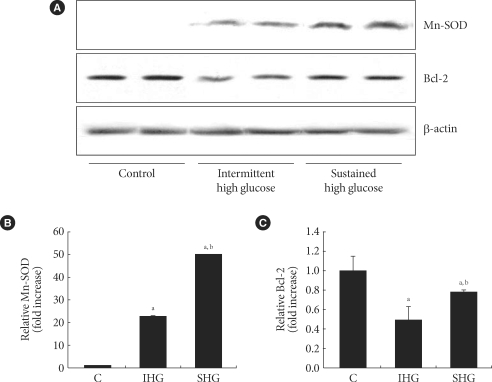
Fig. 5.
The changes of the expression of MnSOD and Bcl-2 in response to control, IHG and SHG. (A) Expression of Mn-SOD and Bcl-2 were evaluated by Western blot analysis. A representative experiment of three is shown. (B, C) Densitometric analyses of western blot are reported as means ± SD of the three different experiments. C, control; IHG, intermittent high glucose; SHG, sustained high glucose. aP < 0.05 vs. control, bP < 0.05 vs. IHG.

