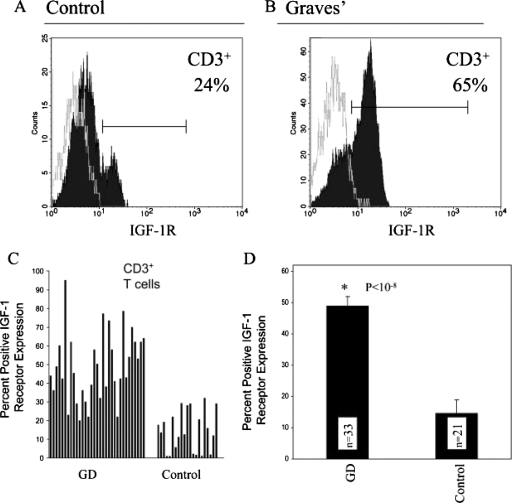
Fig. 6.
Increased fraction of peripheral blood T cells from patients with GD display IGF-IR compared with those from control donors. Peripheral blood mononuclear cells were stained with anti-CD3 and IGF-IR antibodies and subjected to multiparameter flow cytometry. A and B, the open histograms represent staining with isotype control antibodies. Data are derived from single, representative samples from each source. C, fraction of IGF-IR+ CD3+ T cells from individual patients with GD and control donors. D, analysis of IGF-IR display in T cells from the aggregate of multiple patients with GD and control donors; 48 ± 4% GD T cells (n = 33) display IGF-IR compared with 15 ± 3% control T cells (n = 21; p < 10−8). Data are expressed as mean ± S.E. [Reprinted from Douglas RS, Gianoukakis AG, Kamat S, and Smith TJ (2007) Aberrant expression of the IGF-1 receptor by T cells from patients with Graves' disease may carry functional consequences for disease pathogenesis. J Immunol 178:3281–3287. Copyright © 2007 The American Association of Immunologists, Inc. Used with permission.]

