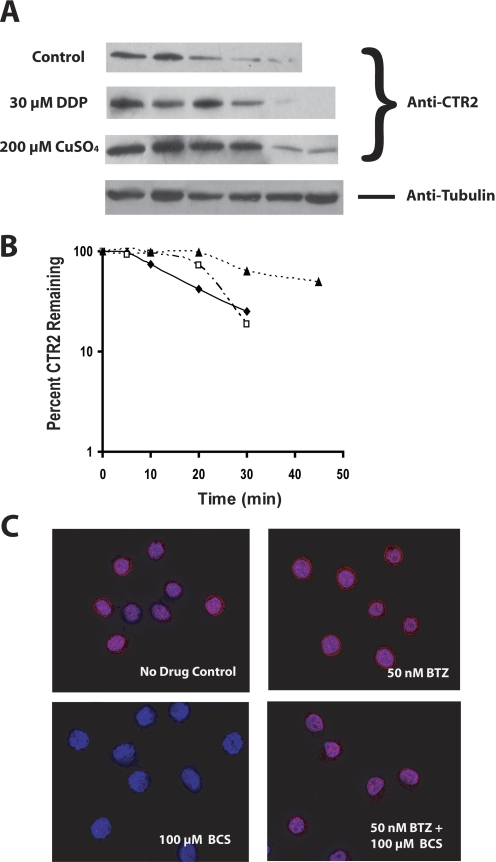
Fig. 3.
Measurement of CTR2 half-life by Western blot. A, blot showing lysates extracted from cells at 0, 5, 10, 20, 30, or 45 min after the start of exposure to 100 μg/ml cyclohexamide. Cells were pretreated with either drug-free media, 200 μM CuSO4, or 30 μM DDP for 1 h before cyclohexamide exposure; ♦, control; □, DDP pretreatment; ▴, copper pretreatment. B, logarithmic representation of the percentage of remaining CTR2 protein as a function of time after the start of cyclohexamide treatment. C, deconvolution microscopy of 2008 cells after exposure to drug-free control media or 50 nM bortezomib in the presence or absence of 100 μM BCS.

