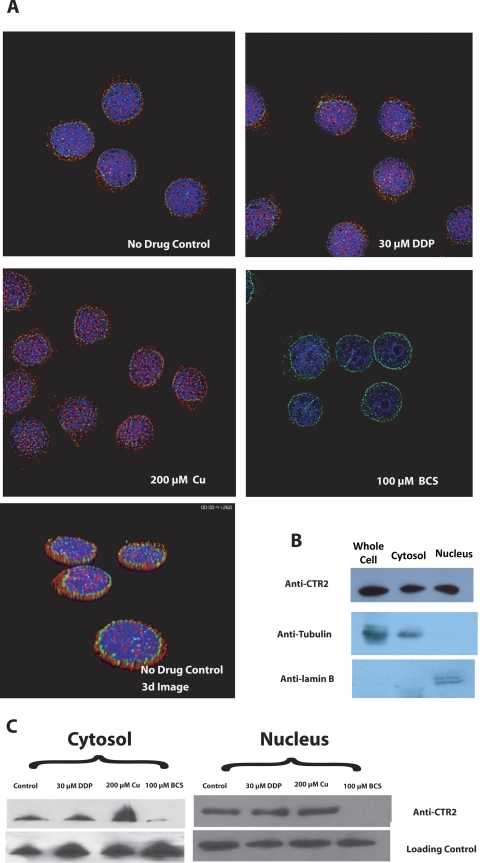
Fig. 5.
A, deconvolution microscopic images of 2008 cells after 1 h of pretreatment with either 200 μM CuSO4, 100 μM BCS, or drug-free media. Red, CTR2; green, NPC proteins. B, Western blot analysis of CTR2, tubulin, and lamin B in the whole cell, cytosolic, and nuclear fractions of 2008 cells. C, Western blot analysis of CTR2 in the cytosolic and nuclear fractions of 2008 cells after 1-h pretreatment with either 200 μM CuSO4, 100 μM BCS, or drug-free media. Loading controls were anti-tubulin (cytosol) and anti-laminin B1 (nucleus).

