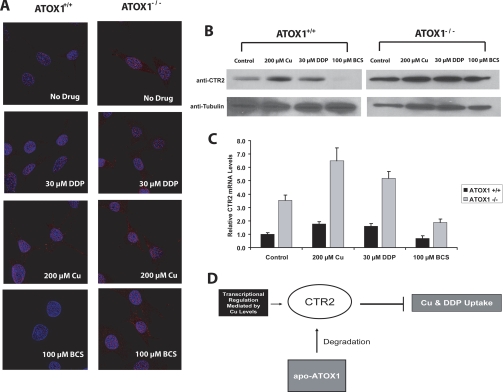
Fig. 6.
A, deconvolution microscopic images of ATOX1(+/+) and ATOX1(−/−) cells after 1 h pretreatment with either 200 μM CuSO4, 100 μM BCS, or drug-free media. CTR2 is shown in red. B, Western blot analysis of CTR2 in ATOX1(+/+) and ATOX1(−/−) cells after a 1-h pretreatment with either 200 μM CuSO4, 100 μM BCS, or drug-free media. C, relative CTR2 mRNA levels measured by qRT-PCR of ATOX1(+/+) (black) and ATOX1(−/−) cells (gray). D, model of CTR2 regulation by ATOX1.

