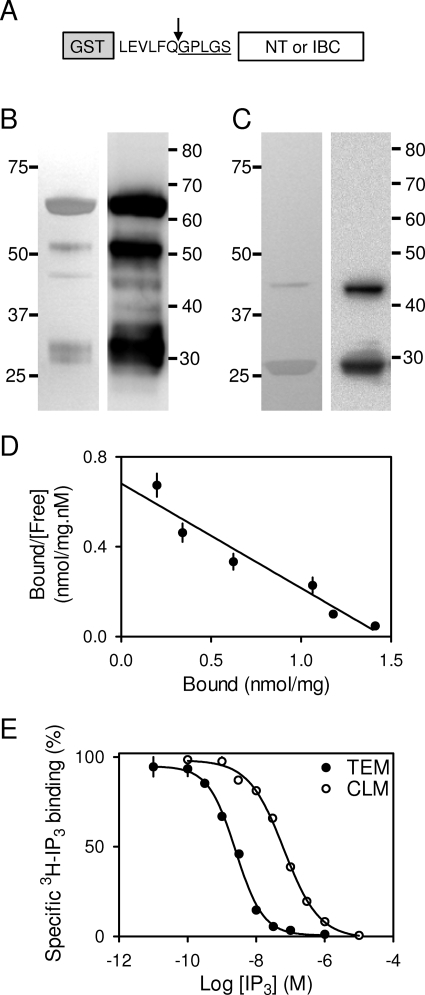
Fig. 2.
Properties of the NT and IBC used for FP assays. The constructs used showing the N-terminal GST tag used for purification, the PreScission cleavage site (arrow), and the N terminus of the protein after cleavage with the residual non-native residues underlined (A). Silver-stained gel (left) and Western blot using antipeptide antiserum to residues 62 to 75 (right) for purified NT (4 μg, 5.1 pmol) (B). Silver-stained gel (left) and immunoblot with antipeptide antiserum to residues 326 to 343 (right) for purified IBC (4 μg, 1.7 pmol) (C). Gels and blots (B and C) are typical of at least three analyses. Positions of molecular mass markers (kDa) are shown alongside each gel. Saturation binding of [3H]IP3 to the NT determined in TEM (30 ng total protein) shown as a Scatchard plot (D). Equilibrium competition binding of IP3 and [3H]IP3 (0.75 nM) to the NT in TEM (150 ng total protein) and CLM (4 μg total protein) (E). Results (D and E) show means ± S.E.M., n = 3.

