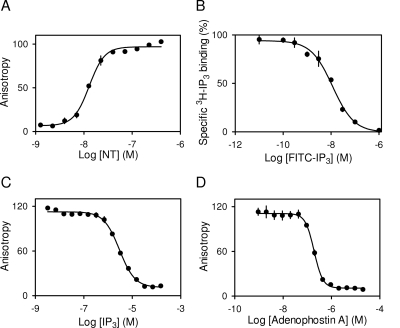
Fig. 3.
Comparison of binding analyses using [3H]IP3 and FP. FP experiment at 4°C using 0.5 nM FITC-IP3 and showing corrected A as a function of increasing concentration of NT (A). Equilibrium competition binding experiments with [3H]IP3 (0.75 nM), NT (4 μg), and the indicated concentrations of FITC-IP3 (B). FP competition binding assay with FITC-IP3 (0.5 nM), NT (80 nM), and the indicated concentrations of IP3 (C) or adenophostin A (D). Results (A–D) are means ± S.E.M., n = 3. All binding analyses (A–D) were performed in CLM. Equivalent analyses with the IBC are shown in Supplemental Fig. 5.

