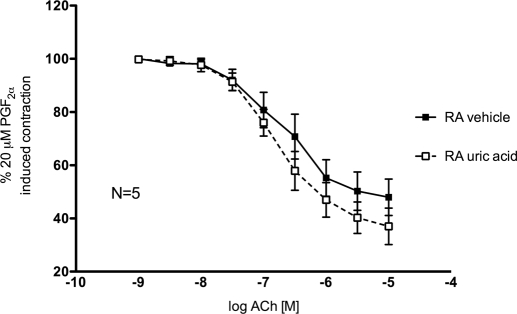
Fig. 1.
Cumulative concentration-response curves to ACh (10−9–10−5 M) of endothelial-intact aorta rings from nontreated rats in the presence of vehicle (closed symbols) or uric acid (100 μM) plus oxonic acid (10 μM) (open symbols). RA, rat aorta. Points represent means ± S.E.M. percentage of contraction induced by 20 μM PGF2α for the respective N.

