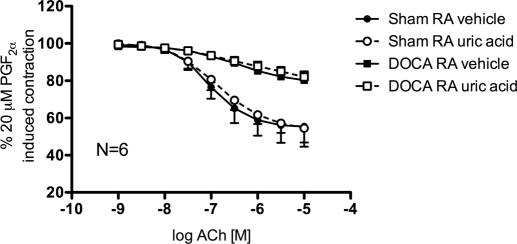
Fig. 2.
Cumulative concentration-response curves to ACh (10−9–10−5 M) of aorta rings from sham normotensive (circles) and DOCA-salt hypertensive rats (squares) in the presence of vehicle (closed symbols) or uric acid (100 μM) plus oxonic acid (10 μM) (open symbols). RA, rat aorta. Points represent means ± S.E.M. percentage of contraction induced by 20 μM PGF2α for the respective N.

