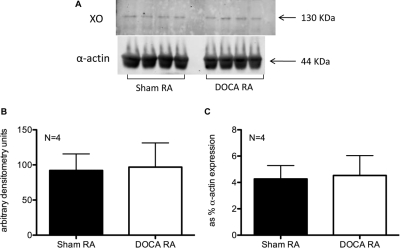
Fig. 6.
A, XO (top) and control α-actin (bottom) protein expression in aorta from sham normotensive and DOCA-salt hypertensive rats. B, band densitometry quantification of XO as the 130-kDa band corresponding to XO. C, band densitometry quantification of XO as percentage of α-actin expression. RA, rat aorta. Bars represent means ± S.E.M. for the respective N.

