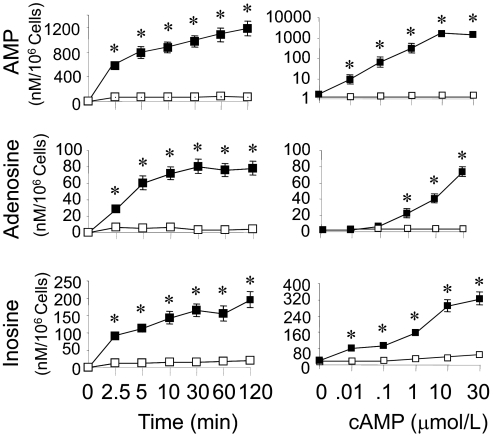
Fig. 1.
Line graphs showing the time-dependent (left) and concentration-dependent (right) metabolism of 3′,5′-cAMP to 5′-AMP (top), adenosine (middle), and inosine (bottom) by cultured human GMCs. For the time course study, cells were treated for 1 to 120 min under standard tissue culture conditions with 30 μM 3′,5′-cAMP (n = 6). For the concentration-dependence study, cells were treated with different concentrations (0.01–30 μM) of 3′,5′-cAMP (n = 6) for 60 min. 5′-AMP, adenosine, and inosine in the medium were analyzed by HPLC. Values are means ± S.E.M. of number of human GMCs cultures. *, p < 0.05 compared with levels at time 0 or levels in medium of GMCs not treated with 3′,5′-cAMP.

