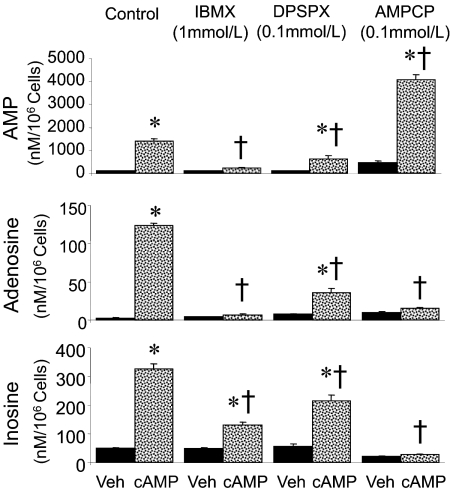
Fig. 2.
Bar graphs showing the metabolism of 3′,5′-cAMP to 5′-AMP (top), adenosine (middle), and inosine (bottom) by human GMCs in the presence and absence of various inhibitors. Cells were treated for 60 min under standard tissue culture conditions with Dulbecco's PBS (Veh; n = 6) or 3′,5′-cAMP (30 μM; n = 6) in the absence or presence of IBMX (1 mM; n = 6), AMPCP (0.1 mM; n = 6), or DPSPX (0.1 mM; n = 6). 5′-AMP, adenosine, and inosine in the medium were analyzed by HPLC. Values are means ± S.E.M. of number of GMC cultures. *, p < 0.05 compared with corresponding vehicle group in pair; †, p < 0.05 compared with control GMCs treated with 3′,5′-cAMP.

