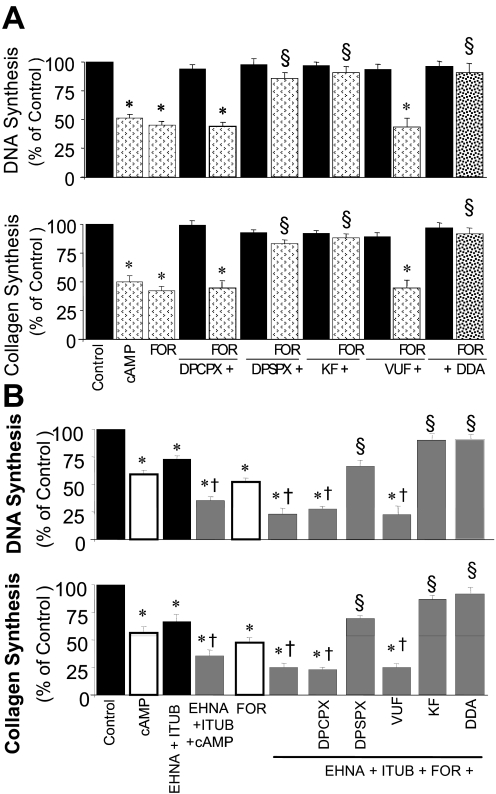
Fig. 4.
A, bar graphs showing the inhibitory effects of FOR on 2.5% FCS-induced DNA synthesis ([3H]thymidine incorporation) (top) and collagen synthesis ([3H]proline incorporation) (bottom) in cultured human GMCs, in the presence and absence of DPSPX (10 nM), KF17837 (10 nM; KF), DPCPX (10 nM), VUF5574 (10 nM; VUF), or DDA (10 μM). Data are presented as percentage of control. Values for each bar represent mean ± S.E.M. from three to four separate experiments, conducted in quadruplicate. *, p < 0.01 compared with control (2.5% FCS); §, p < 0.01 compared with 3′,5′-cAMP or forskolin alone. B, bar graphs showing the inhibitory effects of 3′,5′-cAMP (10 μM) and FOR (10 μM) on FCS (2.5%)-induced DNA synthesis (top) and collagen synthesis (bottom) in human GMCs in the presence of EHNA (10 μM) plus ITUB (0.1 μM). Also shown are the effects of DPSPX (10 nM), KF17837 (10 nM; KF), DPCPX (10 nM), VUF5574 (10 nM; VUF), and DDA (10 μM) on responses to EHNA + ITUB + FOR. *, p < 0.05 versus cells treated with vehicle; §, p < 0.01 versus cells treated with FOR + EHNA + ITUB in PBS; †, p < 0.01 compared with 3′,5′-cAMP or forskolin alone. Data are presented as percentage of control. Values for each bar represent mean ± S.E.M. from three to four separate experiments, conducted in quadruplicate.

