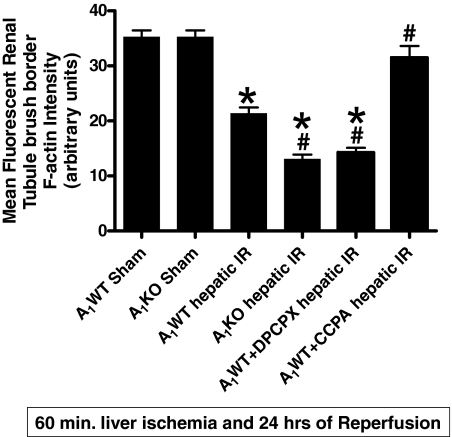
Fig. 11.
Quantification of mean renal proximal tubule F-actin intensity in kidney tissues from sham-operated A1WT mice (A1WT sham) and A1KO mice (A1KO sham), A1WT mice (A1WT hepatic IR) or A1KO mice (A1KO hepatic IR) subjected to 60 min of hepatic ischemia and 24 h of reperfusion, and A1WT mice pretreated with 0.4 mg/kg DPCPX (A1WT hepatic IR+DPCPX) or 0.1 mg/kg CCPA (A1WT hepatic IR+CCPA) and subjected to 60 min of hepatic ischemia and 24 h of reperfusion. *, P < 0.05 versus A1WT or A1KO sham group. #, P < 0.05 versus A1WT hepatic IR group.

