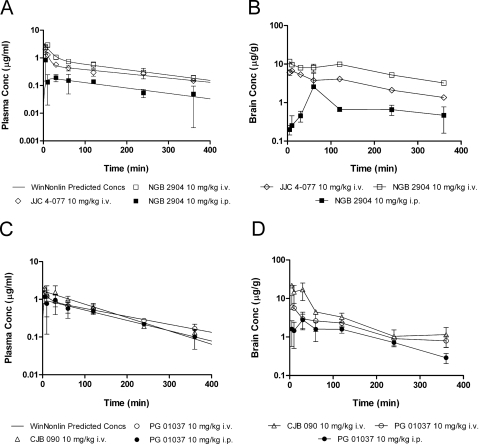
Fig. 2.
Plasma and brain pharmacokinetic profiles of D3R analogs in male Sprague-Dawley rats (n = 3/time point). A, observed (mean ± S.D.) and predicted plasma concentration versus time profiles of the fluorenyl amides based on the naive averaging analysis conducted with WinNonlin. B, observed brain concentrations (mean ± S.D.) versus time profiles of the fluorenyl amides. C, observed (mean ± S.D.) and predicted plasma concentration versus time profiles of the 2-pyridylphenyl amides. D, observed brain concentrations (mean ± S.D.) versus time profiles of the 2-pyridylphenyl amides.

