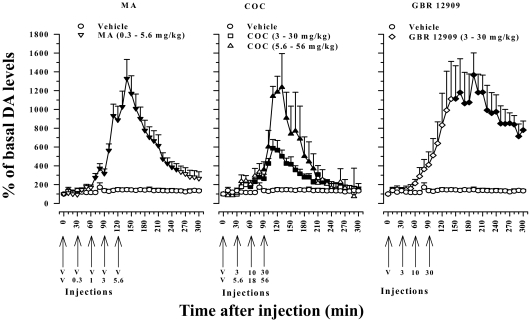
Fig. 3.
Time course of the effects of systemic cumulative administration of vehicle (V), MA (left, 0.3–5.6 mg/kg), COC (center, 3–30 mg/kg; 5.6–56 mg/kg), and GBR 12909 (right, 3–30 mg/kg) on extracellular levels of DA in dialysates samples taken from the NAcb. Arrows indicate the time at which incremental cumulative injections were administered. Ordinates, percentage of basal DA levels; abscissae, time in minutes after injection. Each point represents the mean (±S.E.M.) effect expressed as a percentage of basal values, uncorrected for probe recovery. All data points for all drugs are generated from n of at least four to six subjects. Filled symbols represent values significantly different from basal DA values (p < 0.05).

