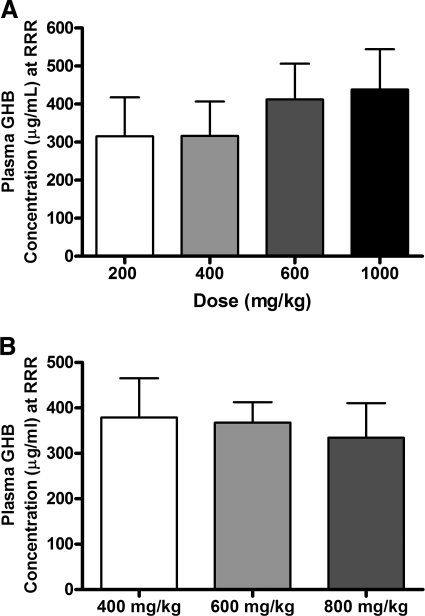
Fig. 3.
Dependence of RRR on plasma GHB concentration. A, plasma GHB concentrations at RRR were calculated by noncompartmental analysis from the GHB pharmacokinetic profiles. Rats were administered GHB by intravenous bolus (200, 400, 600, or 1000 mg/kg), and plasma samples were obtained for up to 6 h after dose. B, plasma GHB concentrations were obtained by destructive sampling at RRR. Rats were administered GHB by intravenous bolus (400, 600, or 800 mg/kg). Data are presented as mean ± S.D. (n = 7–10/dose, except 200 mg/kg where n = 2). There were no statistically significant differences.

