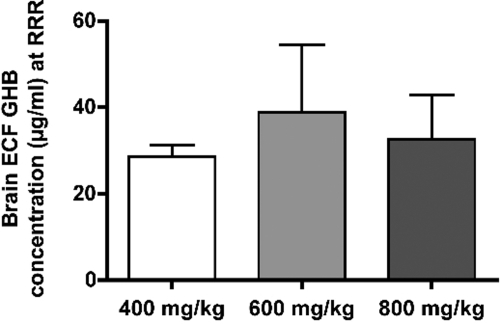
Fig. 6.
TK/TD relationships between GHB concentrations in frontal cortex ECF and RRR. GHB (400, 600, or 800 mg/kg) was administered by intravenous bolus. Dialysate samples were collected in 20-min intervals for 6 h after dose. Frontal cortex ECF GHB concentration at RRR was determined by noncompartmental analysis. Data are presented as mean ± S.D. (n = 3/dose). There were no statistically significant differences.

