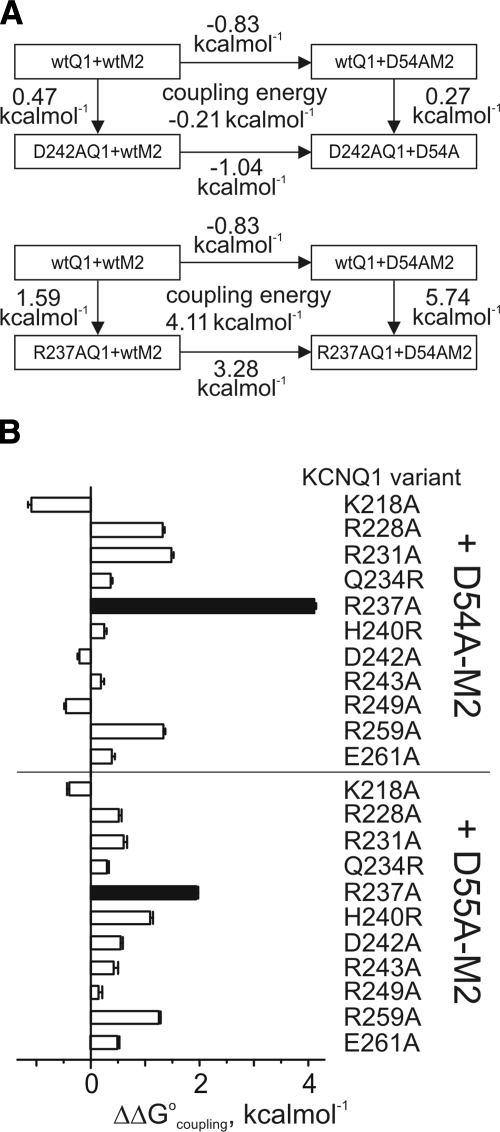
Figure 3.
Double-mutant thermodynamic cycle analysis for MiRP2 and KCNQ1 S4. A) Exemplar double-mutant thermodynamic cycles for D54A-MiRP2 with D242A-KCNQ1 or R237A-KCNQ1. B) Mean coupling energies (ΔΔG°coupling) for the closed to open transition, calculated from tail G/Gmax plots as in Fig. 2B, using ΔΔG° values from Fig. 2C and double-mutant cycles as in A; n = 7–44. Solid bars indicate values of ΔΔG°coupling > 1.5 kcal/mol. wt, wild-type.

