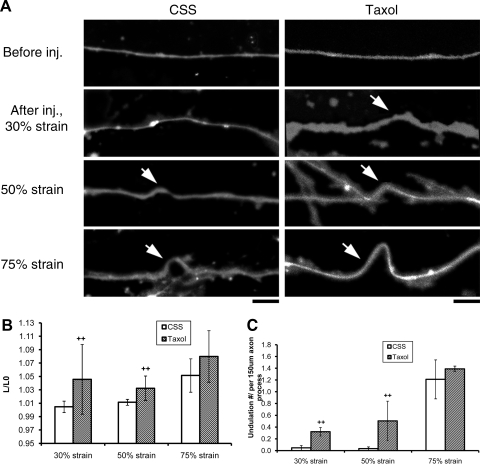
Figure 2.
Degree of axonal undulation is proportional to the applied mechanical strain. A) Fluorescence photomicrograph of axons loaded with fluo-4 displaying multiple undulations (arrow) immediately after stretch (1–30 ms duration, with a fixed strain rate of 44 s−1), the extent of which is proportional to the applied mechanical strain levels. Scale bars = 5 μm. B) Quantitative analysis of total length of axons (normalized to prestretch lengths): 30% strain: CSS (see Materials and Methods), n = 18, taxol, n = 7; 50% strain: CSS, n = 18, taxol, n = 6; 75% strain: CSS, n = 15, taxol, n = 18. n = total number of axons examined. C) Quantitative analysis of undulation densities, defined as number of undulations per axon process of ∼150 μm length: 30% strain: CSS, n = 6, taxol, n = 3; 50% strain: CSS, n = 6, taxol, n = 3; 75% strain: CSS, n = 5, taxol, n = 6. n = total number of microscopic fields examined (field of 150 μm × 113 μm with average ∼50 axons). ++P < 0.01 vs. control CSS; Student’s t test.

