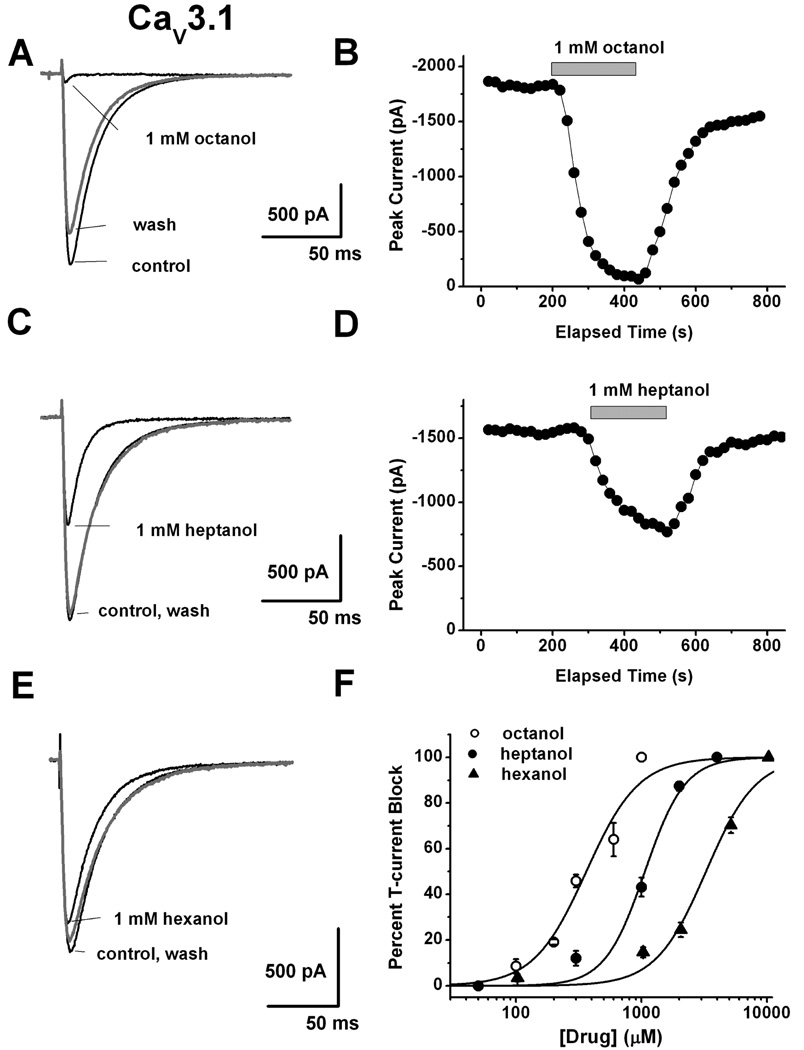
Figure 1. Concentration-dependent inhibition of recombinant human CaV3.1 currents by representative aliphatic alcohols.
A: Representative traces before (control), during, and after (wash) application of 1 mM octanol on HEK293 cells stably expressing CaV3.1 channels. B: Time course from the same cells presented on panel A of this figure showing fast and almost complete reversible inhibition of peak T-current by octanol achieved within < 2 minutes of drug application. C: Black traces indicate T-current before (control) and during, and gray trace depicts T-current after (wash) application of 1 mM heptanol in a representative HEK293 cell stably expressing CaV3.1 channels. D: Time course from the same cells presented on panel C of this figure showing stable baseline T-current amplitudes, fast and almost completely reversible inhibition of about 50% peak T-current by heptanol. E: Black traces indicate T-current before (control) and during, and gray trace depicts T-current after (wash) application of 1 mM hexanol in a representative HEK293 cell stably expressing CaV3.1 channels. Note that at this concentration hexanol had minimal effect on peak T-current. F: This panel summarizes average percent inhibition by multiple concentrations of aliphatic alcohols for octanol (open circles), heptanol (solid circles) and hexanol (solid triangles). Solid lines are best fits of data points using Hill’s equation yielding IC50 and slope (n) values as follows for octanol (362±44 µM, n=2.1±0.5, 26 cells), for heptanol (1063±83 µM, n=2.7±0.6, 29 cells) and for hexanol (3167±329 µM, n=2.2±0.4, 27 cells). All fits are constrained to 100% maximal inhibition.

