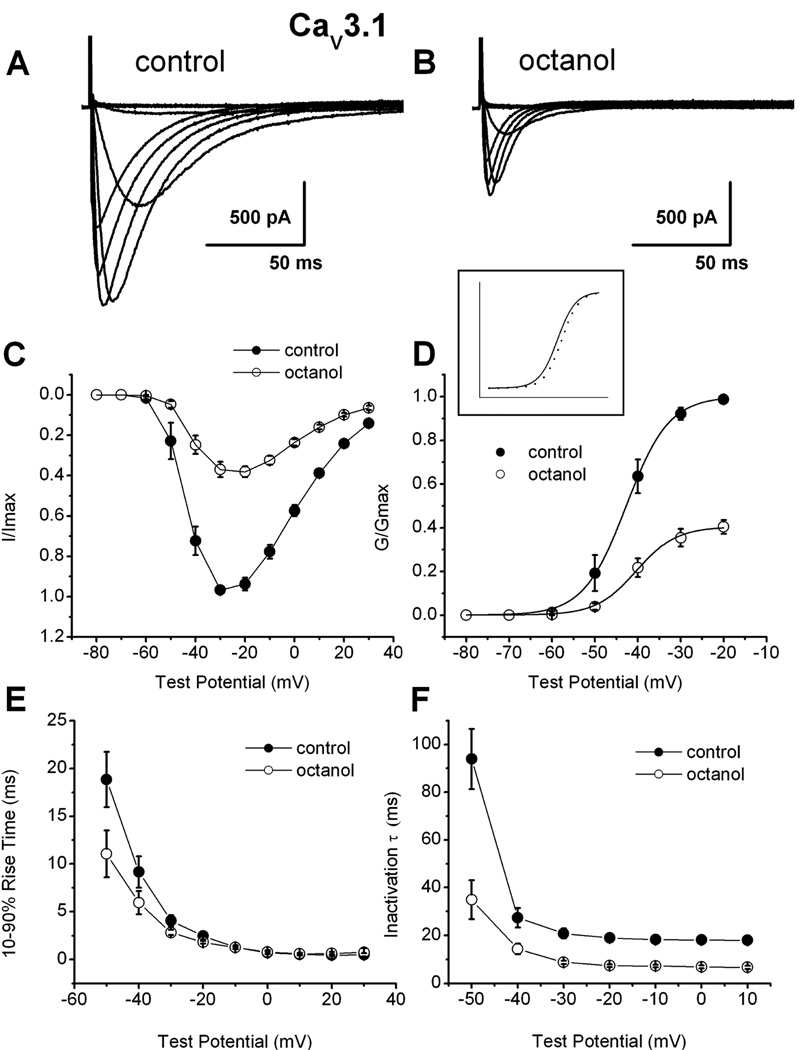
Figure 2. Mechanisms of recombinant CaV3.1 current inhibition by octanol.
A: Traces of inward Ca2+ current in a representative HEK293 cell stably expressing human CaV3.1 constructs in control conditions (Vh −90 mV, Vt from −80 through 30 mV in 10 mV increments). B: Traces from the same cell using the identical voltage-protocol are obtained during an apparent steady-state inhibition of current by 1 mM octanol. C: The data points indicate average I–V relationships before (●) and during (○) the application of 1 mM octanol with vertical bars indicating standard errors of the mean. Currents were elicited by progressing from −80 mV to 30 mV in 10-mV increments from a holding potential of −90 mV (n = 7 cells). Note the depression of the current amplitude at most potentials in the presence of octanol. D. Average conductance and normalized conductance (inset) in whole-cell recordings from I–V experiments depicted in panel C of this figure. The average half-conductance (V50) was in control −42.7 ± 0.2 mV (k = 5.0 ± 0.1 mV) and in the presence of octanol was −40.4 ± 0.3 mV (k = 4.7 ± 0.3 mV). Fits were done using the Boltzmann equation. The estimated reversal potential was taken to be 50 mV. E: All points represent averages (n = 7 cells) of 10–90 rise time of the same cells in the control conditions (solid circles) and in the presence of octanol (open circles). Rise time was measured as time between 10% and 90% of peak current. Calculated values were significant for the Vt points of −50, −40 and 30 mV. For example, at Vt −30 mV rise times were as follows: control, 4.0±0.6; octanol, 2.8±0.3; (p<0.01). F: Rates of macroscopic current inactivation in the same cells (n = 7, error bars represent SEM) from the same cells used to generate current-voltage curves depicted in Figures 2A and 2B in control (filled symbols) and during application of 1 mM octanol (open symbols) for recombinant CaV3.1 currents. All points represent averages from multiple cells where inactivation τ was obtained at indicated potentials by fitting the decaying portion of the current with a single exponential function (p<0.01 at all tested points). For example, at Vt −30 mV inactivation τs were as follows: control, 20.8±2.0; octanol, 8.8±0.7; (p<0.001).

