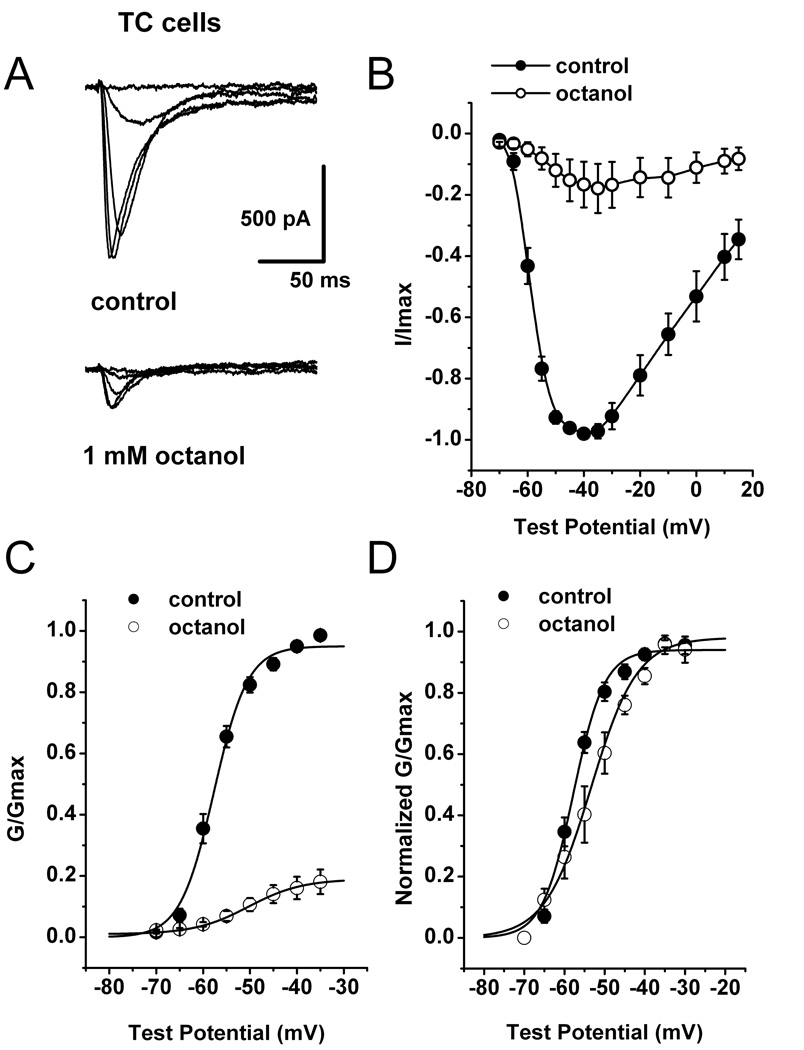
Figure 4. Mechanisms of native CaV3.1 current inhibition by octanol.
A: Families of inward Ca2+ current traces from I–V series from a representative TC neuron. Cell was held at −70 mV, with steps ranging from −65 to −45 mV before (control, top traces) and after 10-min application of 1 mM octanol (bottom traces). B: Average I–V relationships (n = 5) for control conditions (●) and after applying 1 mM octanol (○) at Vh −70 mV and Vt ranging from −70 through 15 mV in 5 mV increments. Vertical lines represent SEM and are visible only if larger than symbols. C: Apparent peak conductance values calculated from I–V curves and plotted against command potentials. Data points (n = 5) were normalized to the peak current elicited (G/Gmax) under control conditions (●). Average conductance after 10 min of 1 mM octanol application is represented by open symbols ( ). The extrapolated reversal potential (E r) was taken to be +55 mV. Data were fitted with a Boltzmann equation (solid lines). Vertical lines represent SEM and are visible only if larger than symbols. D: For easier comparison, the same data from panel C of this figure were normalized to the peak current (G/Gmax) for the control and octanol groups. Octanol shifted activation of the channels to more depolarized potentials; V50: control = −57.7 ± 0.5 mV, octanol = −50.3 ± 0.4 mV, p < 0.05; k: control = 3.6 ± 0.4, octanol = 5.7 ± 0.4.

