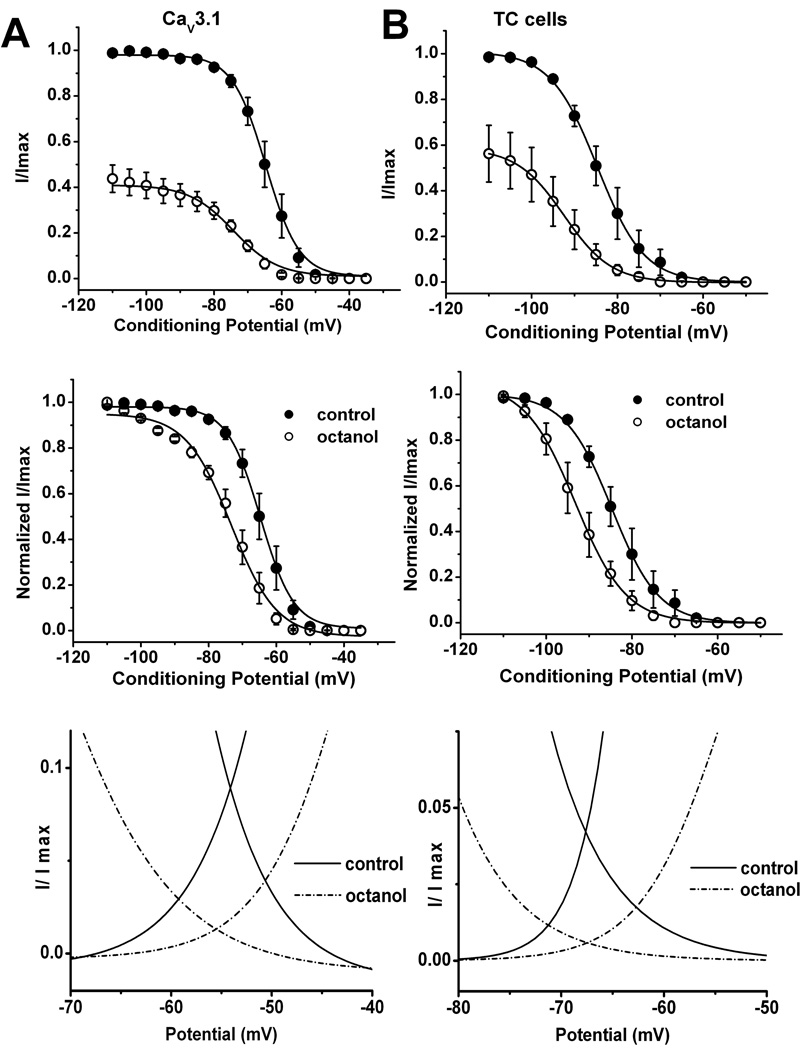
Figure 5. Similar effects of octanol on steady-state inactivation properties of T-currents in TC neurons and recombinant CaV3.1 currents.
A–B: Octanol’s effect on voltage-dependent steady-state inactivation in HEK293 cells (A) and thalamic slices (B). Inactivation kinetics were measured in response to a series of depolarizing command potentials from −110 mV to −50 mV, held for 3.5 sec, then stepping to −50 mV in brain slices or −30 mV in HEK293 cells. For experiments in brain slices we used 1 mM octanol that was applied for 10 minutes, for experiments in HEK293 cells 300 µM octanol was applied for 3 minutes. Top panel show average data points from these experiments with currents elicited at each command potential were normalized to the peak current elicited (I/Imax) for control conditions and middle panels show the same data normalized to each control conditions (filled symbols) and octanol applications (open symbols), and plotted against the command potentials. The averaged data (n = 5) were fitted with a Boltzmann function yielding in brain slices V50: control = −84.7 ± 0.2 mV, octanol = −93.2 ± 0.2 mV, p < 0.05; k: control = 5.46 ± 0.2, octanol = 5.94 ± 0.2. In recombinant HEK293 cells expressing CaV3.1 channels (n = 6) we obtained the following results: V50: control = −64.7 ± 0.2 mV, octanol = −73.3 ± 0.6 mV, p < 0.001; k: control = 4.9 ± 0.2, octanol = 6.7 ± 0.6.
Bottom panels on this figure show window T-current of recombinant CaV3.1 current (on the left) and native T-current sin TC neurons (on the right) consisting of steady-state inactivation curves and activation curves for control (solid lines) and octanol (dashed lines) groups.

