Figure.
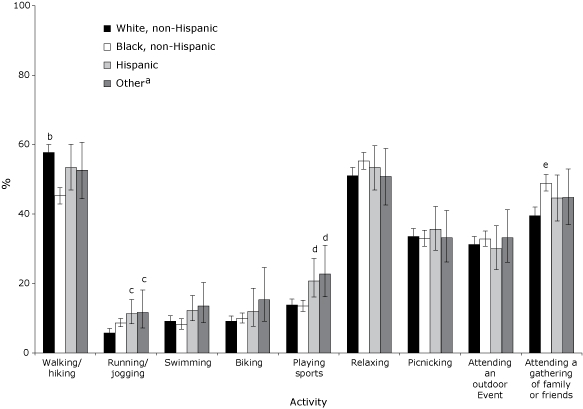
Participation in various activities during the previous 12 months among adult park visitors by race/ethnicity, HealthStyles 2006 (n = 3,763). Respondents were asked to indicate which of the following 9 activities that they had participated in: walking/hiking, picnicking, relaxing, swimming, biking, running/jogging, attending an outdoor event, playing sports, and attending a gathering of family or friends. Respondents could select multiple activities; 175 respondents did not select any. Error bars indicate 95% confidence intervals.
| Activity | Frequency of participation, % (95% Confidence Interval) | |||
|---|---|---|---|---|
| White, non-Hispanic | Black, non-Hispanic | Hispanic | Othera | |
| Walking/hiking | 58 (55-60)b | 45 (39-52) | 53 (48-59) | 53 (44-61) |
| Running/jogging | 6 (5-7) | 9 (6-13) | 11 (8-15)c | 12 (7-18)c |
| Swimming | 9 (8-11) | 8 (5-12) | 12 (9-17)d | 13 (9-20)d |
| Biking | 9 (8-11) | 10 (6-17) | 12 (8-17) | 15 (9-25) |
| Playing sports | 14 (12-15) | 14 (9-20) | 21 (16-26) | 23 (16-31) |
| Relaxing | 51 (49-53) | 55 (49-62) | 53 (47-59) | 51 (43-59) |
| Picnicking | 33 (31-36) | 33 (27-40) | 36 (30-41) | 33 (26-41) |
| Attending an outdoor event | 31 (29-34) | 33 (27-39) | 30 (25-36) | 33 (26-41) |
| Attending a gathering of family or friends | 40 (37-42) | 49 (42-56)e | 45 (39-51) | 45 (37-53) |
“Other” race/ethnicity includes American Indian, Alaska Native, Asian, Native Hawaiian, and other Pacific Islander.
In a pairwise comparison (t test), prevalence was significantly higher than in non-Hispanic blacks (non-Hispanic whites, P = .001, df = 2,979).
In a pairwise comparison (t test), prevalence was significantly higher than in non-Hispanic whites (Hispanics, P = .003, df = 3,069; “other” race/ethnicity, P = .04, df = 2,804).
In a pairwise comparison (t test), prevalence was significantly higher than in non-Hispanic whites (Hispanics, P = .01, df = 3,069; “other” race/ethnicity, P = .02, df = 2,804).
In a pairwise comparison (t test), prevalence was significantly higher than in non-Hispanic whites (non-Hispanic blacks, P = .01, df = 2,979).