Figure.
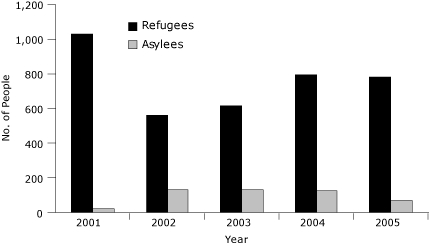
Distribution of refugees and asylees who received health assessment services in Massachusetts, 2001-2005 (N = 4,239).
| Year | Refugees | Asylees | Total |
|---|---|---|---|
| 2001 | 1,027 | 21 | 1,048 |
| 2002 | 556 | 131 | 687 |
| 2003 | 614 | 131 | 745 |
| 2004 | 792 | 123 | 915 |
| 2005 | 776 | 68 | 844 |
| Total | 3,765 | 474 | 4,239 |