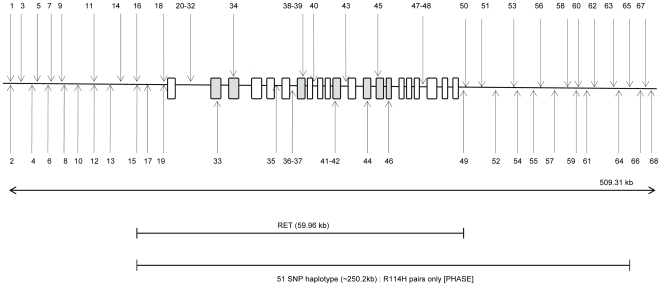
Figure 1. Schematic diagram (not to scale) showing the location of SNPs used in the analysis across the RET gene.
The exons and promoter are represented by rectangles (a darker grey is used for those in which a SNP is located). See Table S1 for the name of each SNP represented in this figure.

