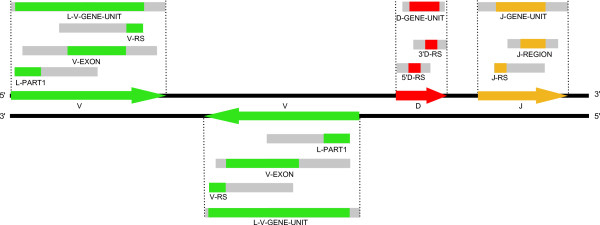
Figure 4.
Grouping of selected labelled HSPs into V, D and J genes. Selected labelled HSPs are grouped into V, D and J genes, respectively. The rectangles in grey represent the length added in 5' and or 3' of the selected HSPs. A search of position overlaps with the other selected and extended HSPs allowed the grouping. Arrows indicate the gene orientation relative to the DNA strand, as deduced by the algorithm by the respective positions of the labelled HSPs. Note that the labels at this stage refer to labelled HSPs and gene identification, and not to a detailed description of the genes.

