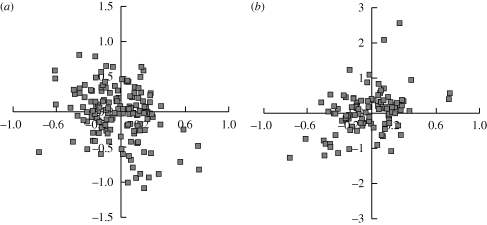
Figure 1.
Bi-plots of mean-centred variable residuals: encephalization (x-axis) is plotted versus (a) litter size and (b) neonate mass. The negative correlation with litter size and positive correlation with neonatal mass point to a conserved reproductive strategy of fewer, larger offspring with increased encephalization, after accounting for among-clade adaptation.

