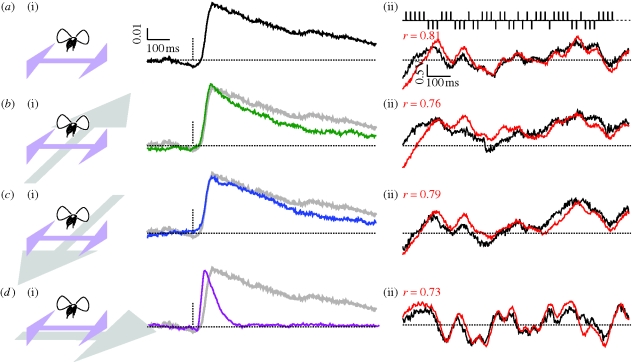
Figure 2.
Impulse responses to sideslip obtained by cross correlation (n = 47), and mean responses to sideslip (n = 52) compared with linear predictions. (a) A white noise sequence modulated visual sideslip with no additional motion. (i) Shows the estimated linear filter, and (ii) shows 1 s of mean difference in wing beat amplitude in black, and the linear prediction in red, responding to sideslip modulated by the partial m-sequence illustrated above. (b) The same white noise sequence in sideslip with forward motion superimposed. (c) The experiment with backward motion superimposed. (d) The same again, but with perpendicular sideslip motion superimposed.

