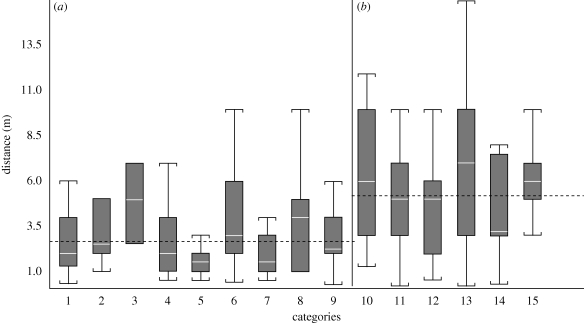
Figure 2.
Average distance (dotted line) maintained between (b) treeshrews and sparrowhawks was significantly greater than between (a) treeshrews and drongos. Distances were significantly greater for groups where drongos were absent. Individual box and whiskers plots denote different combinations of individuals. (a) x′ = 3.09 m, n = 195; (b) x′ = 5.75 m, n = 111. Legend for categories: (a) 1, (1ts, 1dr); 2, (1ts, 2dr); 3, (1ts, 3dr); 4, (1ts, 1dr, 1sh); 5, (1ts, 2dr, 1sh); 6, (2ts, 1dr); 7, (2ts, 2dr); 8, (2ts, 1dr, 1sh); 9, (2ts, 2dr, 1sh); (b) 10, (1ts, 1sh); 11, (1ts, 1dr, 1sh); 12, (1ts, 2dr, 1sh); 13, (2ts, 1sh); 14, (2ts, 1dr, 1sh); 15, (2ts, 2dr, 1sh). ts, treeshrew; dr, drongo; sh, sparrowhawk.

