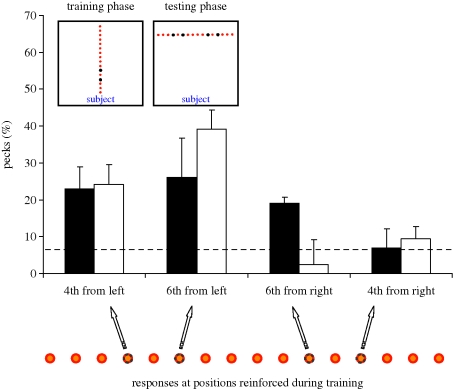
Figure 1.
Left-side bias in birds in an ordinal task. Schematic illustration of the arena set up during training (top left) and during testing (top right), showing the orientation within the arena of the series of 16 positions with respect to the subject. The reinforced positions have been highlighted. The graph represents the mean percentages with s.e.m. ((number of pecks to a given position/20) × 100) of pecks emitted at test by the nutcrackers and by the chicks (either trained on the fourth or on the sixth position) to the correct positions (both from the left and from the right end of the test series). Filled bars, nutcrackers (n = 10); open bars, chicks (n = 14). Below the graph is shown the left–right-oriented test series, highlighting the reinforced positions during training.

