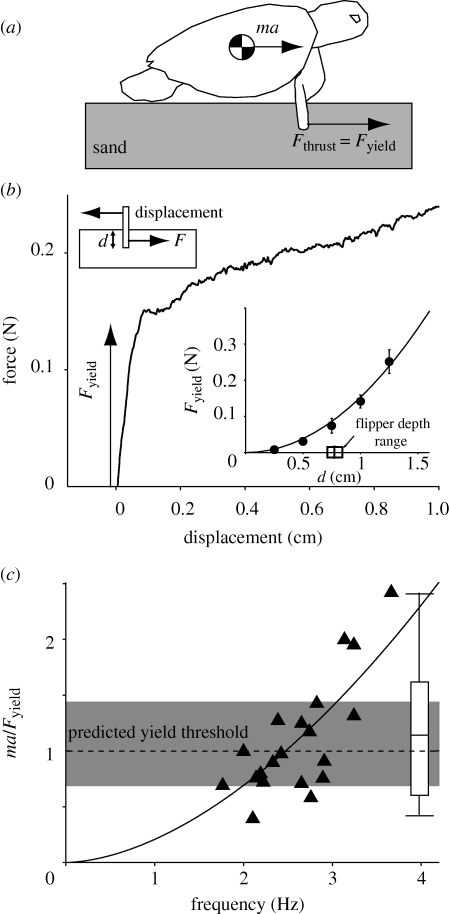
Figure 2.
Model of locomotion on sand: (a) flipper ground reaction force Fthrust and inertial force ma. (b) Drag force versus displacement shows rapid rise in force (the yield force Fyield) for small initial displacement. Inset: quadratic dependence of Fyield on insertion depth d. The bar shows range of measured flipper depths. (c) Normalized turtle inertial force (ma/Fyield) versus limb frequency (fit curve is ma/Fyield = cfn; c = 0.21, n = 1.74, r2 = 0.65). Dashed line indicates predicted yielding threshold for a single flipper inserted to average measured turtle depth (grey region is yield for mean ± s.d. depth).

