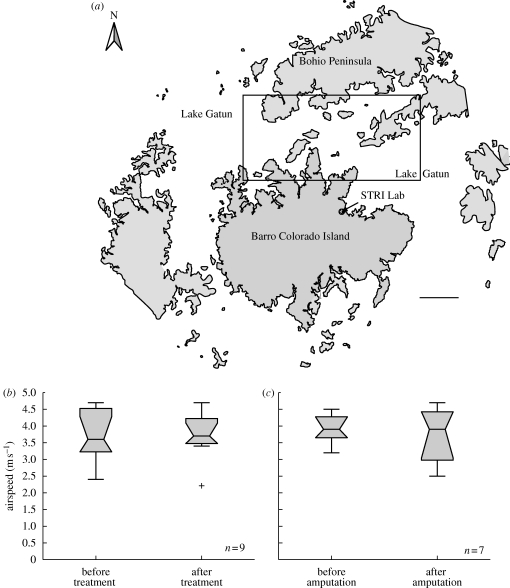
Figure 1.
(a) Rectangle delineates release sites for U. fulgens moths on Lake Gatun, Panama. The lake shore and islands near the site of release are outlined. Migratory airspeeds for (b) sham-treated versus (c) flagella-amputated moths before and after treatment. Airspeed data are plotted as notched, whisker plots. Bottom and top of each box correspond to lower and upper quartile values, respectively. A horizontal black line within each box represents the median. Whiskers represent values up to 1.5 times the interquartile range and plus symbols indicate the outlier points beyond this range. Non-overlapping notches imply different medians at the 5% significance level. (a) Scale bar, 1000 m.

