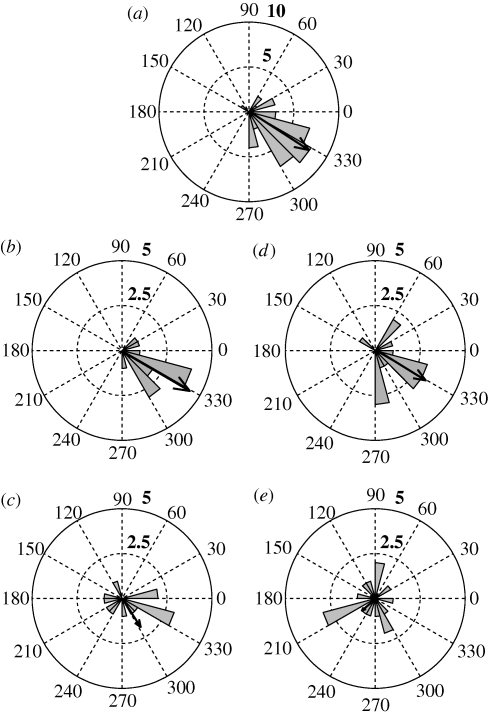
Figure 2.
Rose diagrams of natural flight orientation for U. fulgens moths pre-capture and their orientation after treatment and release over the lake. Black arrows within the plots show the direction (α) and magnitude (r) of the mean orientation vector between 0 (no moths orient in that direction) and 1 (all moths orient in that direction). (a) Pooled data for moths from both treatment groups before capture (n = 38, α = −33°, r = 0.78). (b) Sham-treated moths before capture (n = 13, α = −30°, r = 0.86) and (c) after sham treatment (n = 13, α = −57°, r = 0.36). (d) Experimental moths before capture (n = 16, α = −32°, r = 0.65) and (e) after flagella amputation (n = 16, α = −140°, r = 0.18). Normal numbers, compass directions; grey triangles, number of moths in each 15° compass sector; bold numbers, sample size denoted by each concentric circle.

