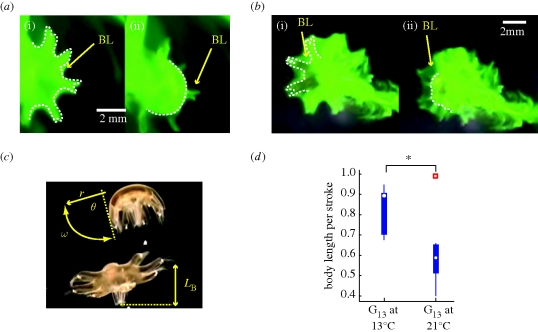
Figure 2.
Dye visualization of boundary layer during powerstroke. Dotted line indicates outline of animal body. BL, boundary layer. (a) Sieve-mode: G13 ephyra swimming at 21°C water temperature. (i) Start of powerstroke, bell is fully relaxed, (ii) end of powerstroke, bell is fully contracted. Note that the thin boundary layer outlines the body but fails to connect between lappets. (b) Paddle-mode: G13 ephyra swimming at 13°C water temperature. (i) Start of powerstroke, bell is fully relaxed, (ii) end of powerstroke, bell is fully contracted. Note the delay in boundary layer motion when compared with body motion, visualizing the velocity gradient at the fluid–solid interface. (c) Parameters of ephyra propulsion. r, Radial position along lappet; θ, swept angle; ω, angular velocity; LB, body length. (d) Effect of ambient water temperature on propulsion efficiency of G13 ephyrae. Box plots show body length travelled per stroke at 13°C (n = 7) and at 21°C (n = 7). White marks correspond to median, the edges of the box are 25th and 75th percentiles, whiskers indicate extreme data points not considered outliers. Outliers are plotted as individual squares. Asterisk represents significant difference in median values.

