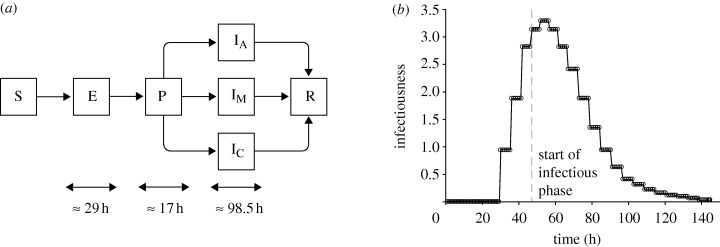
Figure 1.
Transmission model and infectiousness profile. (a) The state transition diagram depicting the SEPIR (susceptible–exposed–pre-symptomatic–infectious–recovered) transmission model for pandemic influenza. The infectious phase is further sub-divided into asymptomatic (IA), mild (IM) and critical (IC) cases. (b) The mean relative infectiousness of a person throughout the various phases.

