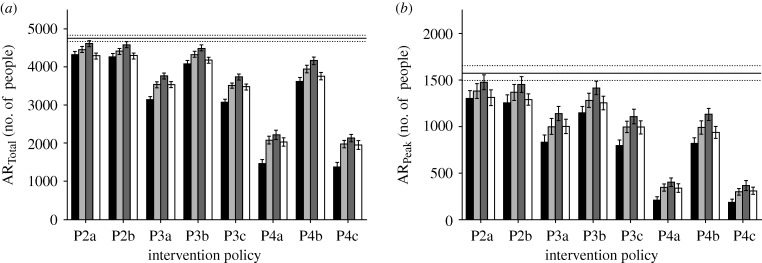
Figure 4.
Total and peak attack rates. The diagram shows (a) the total attack rate and (b) peak attack rate for the various intervention policies. Policy P1 is shown as the base case as it depicts the case where there is no intervention (black bar, D1; light grey bar, D2; dark grey bar, D3; white bar, D4; solid line, base P1).

