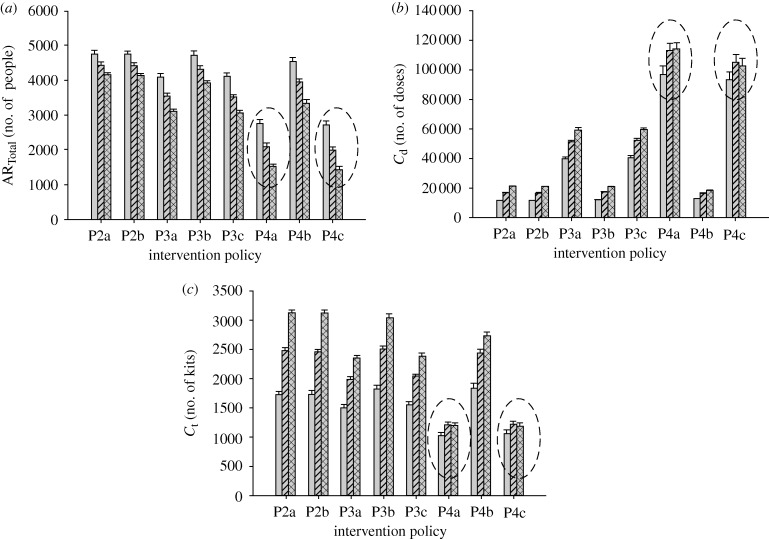
Figure 8.
Effects of varying compliance rates. The graphs show the changes of the (a) total attack rate, (b) drug usage and (c) testkit usage with increasing compliance rates for a particular diagnostic approach (D2). In particular, for policies P4a and P4c (highlighted in dashed circles), higher compliance rate (from 50 to 70%) will result in lower total attack rate, but without a corresponding increase in the resources required (light grey bar, 30% compliance; striped bar, 50% compliance; checked bar, 70% compliance).

