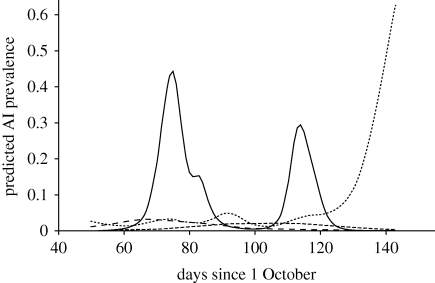
Figure 2.
AI virus infection in staging white-fronted geese during four consecutive winters. Lines indicate the predicted infection probability for male adult geese with average wing length and weight, based on the models given in table 1. In the 2005–2006 and 2006–2007 seasons, AI virus was sampled using cloacal swabs; in the 2007–2008 and 2008–2009 seasons, cloacal and throat swabs were used. An illustration of the observed infection probability is given in the electronic supplementary material, fig. S2. Long-dashed line, 2005–2006; short-dashed line, 2006–2007; solid line, 2007–2008; dotted line, 2008–2009.

