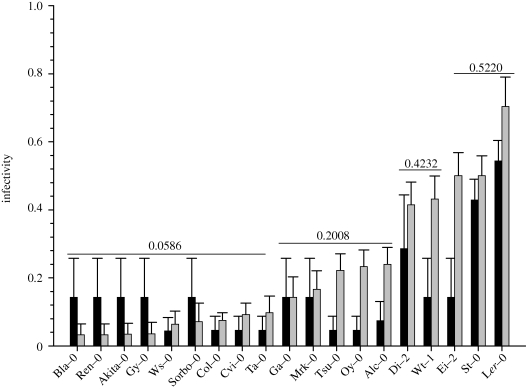
Figure 1.
Estimates of infectivity obtained for the ancestral TEV (black bars) and evolved TEV-At19 (grey bars) genotypes across the 19 different A. thaliana ecotypes used in this study. Infectivity values were computed using the LaPlace's estimator for the Binomial parameter. Error bars represent the 95% CI. Horizontal lines represent groups of ecotypes for which TEV-At17 shows homogeneous infectivity according to the k-means clustering algorithm (average values shown above the line).

