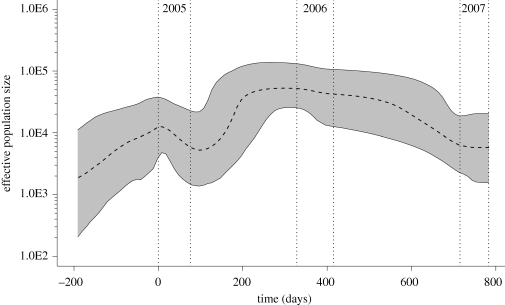
Figure 3.
Bayesian skyline plot of WNV in suburban Chicago, USA. The black bold dashed line represents the median estimate of effective number of infections through time in suburban Chicago, derived from ENV gene sequences using a Bayesian coalescent approach. Genetic distances were transformed into a time scale of days taking into account the different sampling times of WNV in our study area and enforcing a relaxed molecular clock (see §2). Ninety-five per cent HPD values shaded. Vertical dashed grey lines indicate the sampling periods (21 July–4 October 2005, 13 June–7 Septmber 2006, 5 July–9 September 2007) for the WNV sequences analysed in this study.

