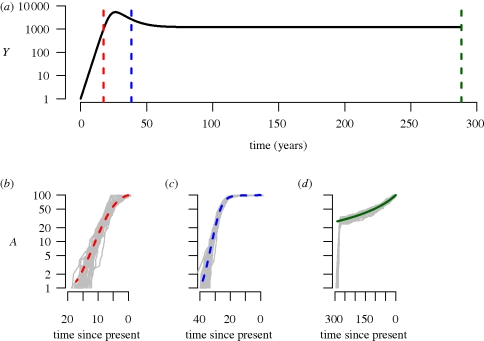
Figure 2.
Phylodynamics of a simple susceptible-infected model in an open population (equations (2.7) and (2.8) in the main text). (a) Dynamics of the number of infected individuals, I over time in years. The vertical lines denote sampling times, and the number of lineages over time (b) during exponential growth (red), (c) following the peak of infected individuals (blue) and (d) at equilibrium (green). The grey lines represent stochastic simulations; in order to generate a fair comparison between the deterministic model and the stochastic simulations, time was shifted for each simulation such that the peak prevalence occurred at the same time as in the deterministic model. Parameter values are as follows (with time in years); βc = 52, γ = 1/10, μ = 1/70, Λ = 10000/70. The initial conditions were: X(0) = 9999, Y(0) = 1. Sampling times were set at 900/52, 2000/52 and 15000/52 years, and a sample size of 100 was assumed, i.e. A = 100. Numerical simulations were performed in R (R Development Core Team 2009) using the simecol library (Petzoldt & Rinke 2007). Stochastic simulations were performed with SimPy (http://simpy.sourceforge.net). All code is available from S.D.W.F. on request.

