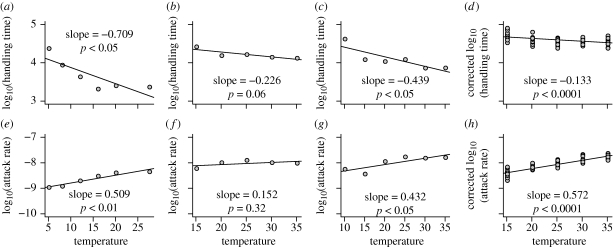
Figure 1.
(a–d) Empirical relationships between temperature and handling times and (e–h) attack rate and temperature from four published studies. The data are plotted on log10 y-axis for clarity, while statistics and the slopes are calculated on natural log data with models equivalent to those in equations (2.2) and (2.4). (a,e) Thompson (1978), (b,f) Zhang et al. (1998), (c,g) Zhang et al. (1999) and (d,h) Xia et al. (2003). In (d,h) the y-axis variables are corrected to account for variation in prey and predator size among the data. In each plot the activation energy is given as the slope and the significance by the p-value.

