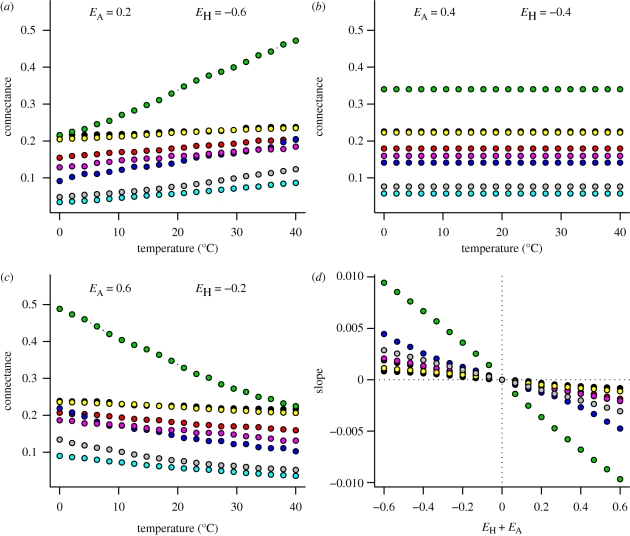
Figure 2.
Effects of temperature on food web connectance for different values of activation energies of attack rates (EA) and handling times (EH), using the power handling time function. Colours refer to different sets of parameter values that correspond to models fitted to eight food webs in Petchey et al. (2008). In (d) the x-axis represents the imbalance between effects of temperature on attack rates and handling times; the y-axis represents the slope of the temperature–connectance relationship. Black, Benguela Pelagic; red, Broadstone stream; green, Coachella; dark blue, EcoWEB41; light blue, Mill stream; pink, Sierra lakes; yellow, Small Reef; grey, Tuesday lake.

